|
Thumbnail |
Title |
Category |
Data Source |
Resource |
|
 |
River Opportunity Area (WI) |
Ecology |
Wisconsin Department of Natural Resources - Bureau of Endangered Resources |
|
|
Abstract:
Displays river system conservation opportunity areas in Wisconsin.
Metadata File
Publication Date: June 2008 -
Data last updated: 2011-09-21
|
|
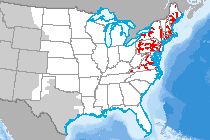 |
River Temperature Model (NE) |
Climate |
City University of New York |
|
|
Abstract:
This dataset depicts modeling results from the Water Balance Model-Thermoelectric Power & Thermal Pollution Model (WBM-TP2M) for the northeast U.S. Together, these models incorporate climate, hydrology, river network dynamics and multi-plant impacts to quantify the following on a per power plant basis and at a regional scale:
• Thermal pollution
• Electricity generation
• Water withdrawal and consumption
• River temperatures and discharge
• Power plant efficiency losses associated with changes in available cooling water and climate conditions
Results here show monthly average temperature changes due to power plant thermal effluents for years 2000 – 2010 Rivers shown have a modeled average summertime discharge of 5 cubic meters/second and higher for the years 2000 – 2010. Temperature changes are given in degrees Celsius and results were computed at a daily time steps and a 5 km cell spatial resolution.
Metadata File
Publication Date: July 2015 -
Data last updated: 2015-09-02
|
|
 |
Roadless Area - Forest Service |
Land Status |
Forest Service |
|
|
Abstract:
Depicts National Forest Inventoried Roadless Areas.
Metadata File
Publication Date: December 2014 -
Data last updated: 2019-01-30
|
|
 |
Roads, with Average Annual Daily Vehicle Traffic |
Transportation |
State Departments of Transportation |
|
|
Abstract:
This layer is a compilation of state-level vehicle road traffic data from Iowa, Illinois, Indiana, Kentucky, Ohio, Pennsylvania, New York, Maryland, Washington DC, Virginia, and West Virginia. Since the database content varies among the source data, only the average annual daily traffic data was kept from each. The source date also varies as follows: 2021 - Kentucky and Pennsylvania; 2020 - Illinois and Iowa; 2019 - Indiana, New York, Ohio; 2018 - Washington DC, Maryland, Virginia.
Metadata File
Publication Date: January 2021 -
Data last updated: 2021-07-28
|
|
 |
Sagebrush Focal Areas Solar Allocations |
Ecology |
Bureau of Land Management |
|
|
Abstract:
This dataset is a modified version of the FWS developed data depicting “Highly Important Landscapes”, as outlined in Memorandum FWS/AES/058711 and provided to the Wildlife Habitat Spatial analysis Lab on October 29th 2014.
Metadata File
Publication Date: July 2015 -
Data last updated: 2016-10-24
|
|
 |
Sagebrush Focal Areas Wind Allocations |
Ecology |
Bureau of Land Management |
|
|
Abstract:
This dataset is a modified version of the FWS developed data depicting “Highly Important Landscapes”, as outlined in Memorandum FWS/AES/058711 and provided to the Wildlife Habitat Spatial analysis Lab on October 29th 2014.
Metadata File
Publication Date: July 2015 -
Data last updated: 2016-10-20
|
|
 |
Saline Formation Suitability |
Geology |
National Energy Technology Laboratory; et al. |
|
|
Abstract:
This layer displays the National Carbon Sequestration Database (NATCARB) of small-scale (large-area) carbon dioxide (CO2) geologic storage potential in saline formations across the USA and parts of Canada.
Metadata File
Publication Date: December 2012 -
Data last updated: 2013-07-29
|
|
 |
Scenic Byway |
Transportation |
Department of Transportation |
|
|
Abstract:
This layer displays the collection of many scenic byways that are found within the United States. They are deemed "scenic" by a government entity, and can be seen on www.byways.org.
Metadata File
Publication Date: 2013 -
Data last updated: 2019-01-29
|
|
 |
School |
Buildings |
Geological Survey - GNIS |
|
|
Abstract:
This layer shows the location of schools in the United States.
Metadata File
Publication Date: December 2016 -
Data last updated: 2017-02-01
|
|
 |
Seafloor Geology |
Geology |
Geological Survey |
|
|
Abstract:
Displays the grain size of seafloor sediments.
Metadata File
Publication Date: 2005 -
Data last updated: 2012-07-18
|
|
 |
Secondary Agriculture Residue 2012 |
Flora |
Bioenergy Knowledge Discovery Framework |
Biomass |
|
Abstract:
This layer displays Secondary Agriculture Residue for the year 2012 as reported from the Bioenergy Knowledge Discovery Framework.
Metadata File
Publication Date: 2011 -
Data last updated: 2012-03-02
|
|
 |
Section 368 Energy Corridor |
Land Status |
Argonne National Laboratory; et al. |
|
|
Abstract:
Depicts Energy Policy Act of 2005, Section 368 energy corridor areas that were designated on federal lands in the Western 11 states. Some corridor areas have notes in the Sec368Status field about special issues in designation that were still being analyzed when this layer was updated (July 26, 2018).
Metadata File
Publication Date: July 2018 -
Data last updated: 2019-01-29
|
|
 |
Sediment Texture |
Geology |
Geological Survey |
|
|
Abstract:
Locations of marine sediment samples collected and (or) analyzed by the U.S. Geological Survey, Woods Hole Coastal and Marine Science Center starting in 1955 thru March 2014.
Metadata File
Data last updated: 2017-01-11
|
|
 |
Sedimentary Basins with Shale Plays |
Geology |
Energy Information Administration |
|
|
Abstract:
Sedimentary basins associated with the EIA shale plays as of 5-6-2011. Sedimentary basin which do not have shale plays as of publication date are not included in this file. Sources for the basins are mostly from the US Geological Survey and state agencies such as the WY Geological Survey.
Metadata File
Publication Date: May 2011 -
Data last updated: 2020-10-15
|
|
 |
Seismic Risk (2% in 50 years) |
Geology |
Geological Survey |
|
|
Abstract:
Depicts risk of seismic peak horizontal ground acceleration (the fastest measured change in speed, for a particle at ground level that is moving horizontally due to an earthquake) with a 2% probability of exceedance in 50 years. Values are given in %g, where g is acceleration due to gravity, or 9.8 meters/second^2. The lines of equal hazard, which are the lines between the polygons, were determined by interpolating from a grid of equally spaced points in latitude and longitude. Each point was weighted based on the seismic hazard at that location. The grid spacing is 0.1 degrees for Alaska, 0.05 degrees for the conterminous United States, and 0.02 degrees for Hawaii.
Metadata File
Publication Date: January 2021 -
Data last updated: 2022-06-08
|