|
Thumbnail |
Title |
Category |
Data Source |
Resource |
|
 |
Federal Land (Surface Management Agency) |
Cadastre |
Bureau of Land Management |
|
|
Abstract:
The Surface Management Agency (SMA) Geographic Information System (GIS) dataset depicts Federal land for the United States and classifies this land by its active Federal surface managing agency.
Metadata File
Publication Date: October 2023 -
Data last updated: 2023-11-30
|
|
 |
Public Land Survey System - Townships |
Cadastre |
Bureau of Land Management |
|
|
Abstract:
Depicts Public Land Survey System Townships.
Metadata File
Publication Date: September 2023 -
Data last updated: 2024-01-08
|
|
 |
Public Land Survey System - Sections |
Cadastre |
Bureau of Land Management |
|
|
Abstract:
Depicts Public Land Survey System Sections.
Metadata File
Publication Date: September 2023 -
Data last updated: 2024-01-08
|
|
 |
Forest Service Jurisdiction |
Cadastre |
Forest Service |
|
|
Abstract:
Depicts cadastral land parcels administered by the U.S. Forest Service with their associated Forest Service unit name and type.
Metadata File
Publication Date: December 2023 -
Data last updated: 2024-01-25
|
|
 |
Atlantic OCS Wind Energy Area |
Climate |
Bureau of Ocean Energy Management |
|
|
Abstract:
Wind planning areas are offshore locations that appear most suitable for wind energy development.
Metadata File
Publication Date: September 2013 -
Data last updated: 2014-04-02
|
|
 |
Cooling Degree Days - Higher Emissions (2070-2099) |
Climate |
National Oceanic and Atmospheric Administration; et al. |
|
|
Abstract:
This raster dataset displays the average of cooling degree days projections from several climate models for the higher emissions (A2) scenario, for the period of 2070-2099, relative to 1971-1999. Cooling degree days are defined as the number of degrees that a day’s average temperature is above 65ºF.
Metadata File
Publication Date: November 2013 -
Data last updated: 2015-03-23
|
|
 |
Cooling Degree Days - Higher Emissions (2021-2050) |
Climate |
National Oceanic and Atmospheric Administration; et al. |
|
|
Abstract:
This raster dataset displays the average of cooling degree days projections from several climate models for the higher emissions (A2) scenario, for the period of 2021-2050, relative to 1971-1999. Cooling degree days are defined as the number of degrees that a day’s average temperature is above 65ºF.
Metadata File
Publication Date: November 2013 -
Data last updated: 2015-03-23
|
|
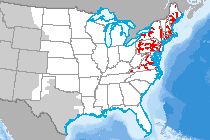 |
River Temperature Model (NE) |
Climate |
City University of New York |
|
|
Abstract:
This dataset depicts modeling results from the Water Balance Model-Thermoelectric Power & Thermal Pollution Model (WBM-TP2M) for the northeast U.S. Together, these models incorporate climate, hydrology, river network dynamics and multi-plant impacts to quantify the following on a per power plant basis and at a regional scale:
• Thermal pollution
• Electricity generation
• Water withdrawal and consumption
• River temperatures and discharge
• Power plant efficiency losses associated with changes in available cooling water and climate conditions
Results here show monthly average temperature changes due to power plant thermal effluents for years 2000 – 2010 Rivers shown have a modeled average summertime discharge of 5 cubic meters/second and higher for the years 2000 – 2010. Temperature changes are given in degrees Celsius and results were computed at a daily time steps and a 5 km cell spatial resolution.
Metadata File
Publication Date: July 2015 -
Data last updated: 2015-09-02
|
|
 |
Cooling Degree Days - Lower Emissions (2021-2050) |
Climate |
National Oceanic and Atmospheric Administration; et al. |
|
|
Abstract:
This raster dataset displays the average of cooling degree days projections from several climate models for the lower emissions (B1) scenario, for the period of 2021-2050, relative to 1971-1999. Cooling degree days are defined as the number of degrees that a day’s average temperature is above 65ºF.
Metadata File
Publication Date: November 2013 -
Data last updated: 2015-03-23
|
|
 |
Cooling Degree Days - Lower Emissions (2070-2099) |
Climate |
National Oceanic and Atmospheric Administration; et al. |
|
|
Abstract:
This raster dataset displays the average of cooling degree days projections from several climate models for the lower emissions (B1) scenario, for the period of 2070-2099, relative to 1971-1999. Cooling degree days are defined as the number of degrees that a day’s average temperature is above 65ºF.
Metadata File
Publication Date: November 2013 -
Data last updated: 2015-03-23
|
|
 |
Renewable Energy Leasing Area - New Jersey |
Climate |
Bureau of Ocean Energy Management |
|
|
Abstract:
New Jersey Wind Energy Area (WEA) lease block area which will go up for auction November 9th, 2015. The New Jersey WEA will be auctioned as two leases (OCS-A 0498 and OCS-A 0499).
Metadata File
Publication Date: 2015 -
Data last updated: 2015-10-21
|
|
 |
Projected Annual Temperature Change (2071-2099) |
Climate |
National Oceanic and Atmospheric Administration; et al. |
|
|
Abstract:
This raster dataset displays projected change in average annual surface air temperature for 2071-2099 relative to 1970-1999 for the lower emissions (B1) and higher emissions (A2) scenarios.
Metadata File
Publication Date: November 2013 -
Data last updated: 2015-04-20
|
|
 |
Renewable Energy Leasing Area |
Climate |
Bureau of Ocean Energy Management |
|
|
Abstract:
This layer displays active renewable energy leasing areas on the Atlantic Outer Continental Shelf (OCS).
Metadata File
Publication Date: March 2016 -
Data last updated: 2016-04-04
|
|
 |
Keetch-Byram Drought Index (KBDI) Modeled 95th Percentile Projections |
Climate |
Argonne National Laboratory |
|
|
Abstract:
Depicts statistics for the Keetch-Byram Drought Index, (KBDI) which is used as a measure of wildfire risk, specifically the 95th percentile of the KBDI values for the historical period and the number of days exceeding the historical 95th percentile for the mid-century, and end-of-century periods, based on climate modeling results.
Metadata File
Publication Date: August 2021 -
Data last updated: 2021-09-02
|
|
 |
Potential Wind Capacity - 80-m (Near-Future) |
Climate |
National Renewable Energy Laboratory |
|
|
Abstract:
80-Meter Hub Height (Near Future) Potential Wind Capacity
Metadata File
Publication Date: May 2015 -
Data last updated: 2018-08-15
|