|
Thumbnail |
Title |
Category |
Data Source |
Resource |
|
 |
Solar Potential: 1-Axis Tracking Flat-Plate Collector |
Climate |
National Renewable Energy Laboratory; et al |
Solar |
|
Abstract:
Solar resource potential for the 48 contiguous states. The insolation values represent the average solar energy available to a concentrating collector on a 1-axis tracker, such as a dish or a power tower.
Metadata File
Publication Date: March 2007 -
Data last updated: 2019-01-29
|
|
 |
Wind Technical Potential (2020) |
Utilities |
National Renewable Energy Laboratory |
Solar |
|
Abstract:
Depicts estimated 2020 technical generation potential, by county, for commercial photovoltaic, concentrating solar, distributed wind, land-based wind, residential photovoltaic, and utility photovoltaic technologies. Technical generation potential is the upper bound of generation based on resource, system performance, topographic limitations, and environmental and land-use constraints, not market conditions. Estimates are modeled and have a high degree of uncertainty. See https://gds.nrel.gov/slope for more information.
Metadata File
Publication Date: January 2020 -
Data last updated: 2022-08-09
|
|
 |
Pumped Storage Pending Preliminary Permit |
Hydrography |
Federal Energy Regulatory Commission |
Storage |
|
Abstract:
Pending preliminary permits for pumped storage projects by the Federal Energy Regulatory Commission. Preliminary permits are issued for up to three years, and do not authorize construction; rather, it maintains priority of application for a license (i.e., guaranteed first-to-file status) while the permittee studies the site and prepares to apply for a license. The permittee must submit periodic reports on the status of its studies. It is not necessary to obtain a permit in order to apply for or receive a license.
Metadata File
Publication Date: November 2011 -
Data last updated: 2011-11-14
|
|
 |
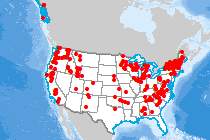
Pumped Storage Site |
Hydrography |
Sandia National Laboratories |
Storage |
|
Abstract:
Depicts pumped storage facility locations throughout the United States.
Metadata File
Publication Date: October 2016 -
Data last updated: 2016-11-22
|
|
 |
Pumped Storage Issued Preliminary Permit |
Hydrography |
Federal Energy Regulatory Commission |
Storage |
|
Abstract:
Issued preliminary permits for pumped storage projects by the Federal Energy Regulatory Commission. Preliminary permits are issued for up to three years, and do not authorize construction; rather, it maintains priority of application for a license (i.e., guaranteed first-to-file status) while the permittee studies the site and prepares to apply for a license. The permittee must submit periodic reports on the status of its studies. It is not necessary to obtain a permit in order to apply for or receive a license.
Metadata File
Publication Date: November 2011 -
Data last updated: 2011-11-14
|
|
 |
Domal Salt Formation |
Geology |
Oak Ridge National Laboratory |
Storage |
|
Abstract:
The geographic location of possible domal salt formations in the United States.
Metadata File
Data last updated: 2013-02-01
|
|
 |
Wave Energy - Water Depth |
Hydrography |
National Renewable Energy Laboratory; et al. |
Water |
|
Abstract:
Wave Depth Study from the Wave Energy Resource Assessment of the United States.
Metadata File
Publication Date: October 2011 -
Data last updated: 2012-05-10
|
|
 |
Wave Energy - Power Density |
Hydrography |
National Renewable Energy Laboratory; et al. |
Water |
|
Abstract:
Wave Power Density from the Wave Energy Resource Assessment of the United States.
Metadata File
Publication Date: October 2011 -
Data last updated: 2012-05-10
|
|
 |
Wave Energy - Significant Wave Height |
Hydrography |
National Renewable Energy Laboratory; et al. |
Water |
|
Abstract:
Significant Wave Height from the Wave Energy Resource Assessment of the United States.
Metadata File
Publication Date: October 2011 -
Data last updated: 2012-05-10
|
|
 |
Wave Energy - Energy Period |
Hydrography |
National Renewable Energy Laboratory; et al. |
Water |
|
Abstract:
Wave Energy Period from the Wave Energy Assessment of the United States.
Metadata File
Publication Date: October 2011 -
Data last updated: 2012-05-10
|
|
 |
Tidal - Mean Current Speed |
Hydrography |
Georgia Institute of Technology - Savannah |
Water |
|
Abstract:
This layer displays the mean current speed for tidal streams in the United States.
Metadata File
Publication Date: May 2011 -
Data last updated: 2016-10-11
|
|
 |
Tidal - Mean Kinetic Power Density |
Hydrography |
Georgia Institute of Technology - Savannah |
Water |
|
Abstract:
This layer displays the mean kinetic power density for tidal streams in the United States.
Metadata File
Publication Date: May 2011 -
Data last updated: 2016-10-11
|
|
 |
Dams |
Utilities |
Army Corps of Engineers |
Water |
|
Abstract:
Depicts dams in the U.S. meeting at least one of the following criteria; 1) High hazard potential classification - loss of human life is likely if the dam fails, 2) Significant hazard potential classification - no probable loss of human life but can cause economic loss, environmental damage, disruption of lifeline facilities, or impact other concerns, 3) Equals or exceeds 25 feet in height and exceeds 15 acre-feet in storage, 4) Equals or exceeds 50 acre-feet storage and exceeds 6 feet in height.
Metadata File
Publication Date: April 2022 -
Data last updated: 2022-08-24
|
|
 |
Hydro Run of River Max Monthly Generation (1970 - 2015, May) |
Hydrography |
Argonne National Laboratory |
Water |
|
Abstract:
Depicts run-of-river (ROR) hydroelectric power plant sites in the U.S., attributed with descriptive information, and minimum and maximum power generation by month of year between 1970 and 2015. Symbolization shows the maximum monthly generation occurring between 1970 and 2015 in the month of May, which is the month with the highest overall generation.
Metadata File
Publication Date: December 2016 -
Data last updated: 2016-12-22
|
|
 |
Hydro Run of River Min Monthly Generation (1970 - 2015, September) |
Hydrography |
Argonne National Laboratory |
Water |
|
Abstract:
Depicts run-of-river (ROR) hydroelectric power plant sites in the U.S., attributed with descriptive information, and minimum and maximum power generation by month of year between 1970 and 2015. Symbolization shows the minimum monthly generation occurring between 1970 and 2015 in the month of September, which is the month with the lowest overall generation.
Metadata File
Publication Date: December 2016 -
Data last updated: 2016-12-22
|