|
Thumbnail |
Title |
Category |
Data Source |
Resource |
|
 |
Underground Coal Mine - Liberated Methane Emissions |
Environmental Hazards |
Argonne National Laboratory |
|
|
Abstract:
Depicts annual liberated methane emissions from underground coal mines in the United States in 2019.
Metadata File
Publication Date: December 2019 -
Data last updated: 2023-11-28
|
|
 |
Underground Coal Mine - Net Methane Emissions |
Environmental Hazards |
Argonne National Laboratory |
|
|
Abstract:
Depicts annual net methane emissions from underground coal mines in the United States in 2019.
Metadata File
Publication Date: December 2019 -
Data last updated: 2023-11-28
|
|
 |
Underground Coal Mine - Captured Methane Emissions |
Environmental Hazards |
Argonne National Laboratory |
|
|
Abstract:
Depicts annual captured methane emissions from underground coal mines in the United States in 2019.
Metadata File
Publication Date: December 2019 -
Data last updated: 2023-11-28
|
|
 |
Household Transportation Energy Burden |
Demographics |
Argonne National Laboratory |
|
|
Abstract:
Depicts census-tract-level estimates of household transportation energy affordability in terms of the transportation energy burden, defined as the percentage of annual household income spent on the household vehicle fuel costs.
Metadata File
Publication Date: December 2020 -
Data last updated: 2021-06-04
|
|
 |
Keetch-Byram Drought Index (KBDI) Observed Days over 600 |
Climate |
Argonne National Laboratory |
|
|
Abstract:
Depicts statistics for the Keetch-Byram Drought Index, (KBDI) which is used as a measure of wildfire risk, specifically the number of days with KBDI values over 600 for the years 1996-2000, based on historical observations.
Metadata File
Publication Date: August 2021 -
Data last updated: 2021-09-07
|
|
 |
Keetch-Byram Drought Index (KBDI) Observed 99th Percentile |
Climate |
Argonne National Laboratory |
|
|
Abstract:
Depicts statistics for the Keetch-Byram Drought Index, (KBDI) which is used as a measure of wildfire risk, specifically the 99th percentile of the KBDI values for the years 1996-2000, based on historical observations.
Metadata File
Publication Date: August 2021 -
Data last updated: 2021-09-07
|
|
 |
Keetch-Byram Drought Index (KBDI) Modeled days over 600 projections |
Climate |
Argonne National Laboratory |
|
|
Abstract:
Depicts statistics for the Keetch-Byram Drought Index, (KBDI) which is used as a measure of wildfire risk, specifically the number of days with KBDI values over 600 for historical, mid-century, and end-of-centry years, based on climate modeling results.
Metadata File
Publication Date: August 2021 -
Data last updated: 2021-09-02
|
|
 |
Prison |
Buildings |
Argonne National Laboratory |
|
|
Abstract:
The USA Prisons database is a geographic point database of State and Federal Adult Correction agencies in the United States. Attribute data provides location information and a some information about the facility. The attribute data has been taken from the Census of State and Federal Adult Correction Facilities, compiled by DOJ.
Metadata File
Publication Date: 2004 -
Data last updated: 2012-04-23
|
|
 |
National Monument |
Land Status |
Argonne National Laboratory |
|
|
Abstract:
This dataset was compiled for use as a complete set of the National Monuments administered by all federal agencies of the U.S.
Metadata File
Publication Date: 2014 -
Data last updated: 2015-08-14
|
|
 |
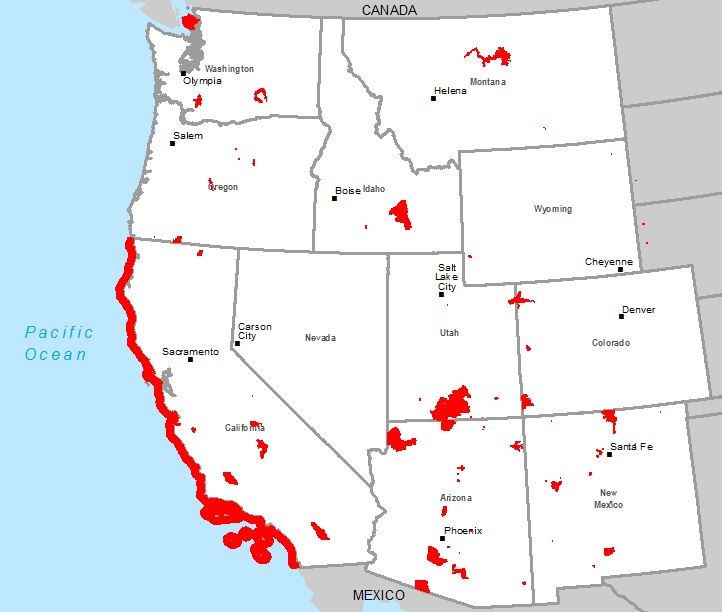
Solar Energy Zones |
Land Status |
Argonne National Laboratory |
|
|
Abstract:
This dataset represents Solar Energy Zones available for utility-grade solar energy development under the Bureau of Land Management's Solar Energy Program Western Solar Plan. For details and definitions, see the website at http://blmsolar.anl.gov/sez/.
Metadata File
Publication Date: July 2022 -
Data last updated: 2022-07-19
|
|
 |
College/University |
Buildings |
Argonne National Laboratory |
|
|
Abstract:
This layer displays Colleges and Universities in the United States.
Metadata File
Data last updated: 2012-04-23
|
|
 |
Keetch-Byram Drought Index (KBDI) Modeled 95th Percentile Projections |
Climate |
Argonne National Laboratory |
|
|
Abstract:
Depicts statistics for the Keetch-Byram Drought Index, (KBDI) which is used as a measure of wildfire risk, specifically the 95th percentile of the KBDI values for the historical period and the number of days exceeding the historical 95th percentile for the mid-century, and end-of-century periods, based on climate modeling results.
Metadata File
Publication Date: August 2021 -
Data last updated: 2021-09-02
|
|
 |
Hydro Run of River Min Monthly Generation (1970 - 2015, September) |
Hydrography |
Argonne National Laboratory |
Water |
|
Abstract:
Depicts run-of-river (ROR) hydroelectric power plant sites in the U.S., attributed with descriptive information, and minimum and maximum power generation by month of year between 1970 and 2015. Symbolization shows the minimum monthly generation occurring between 1970 and 2015 in the month of September, which is the month with the lowest overall generation.
Metadata File
Publication Date: December 2016 -
Data last updated: 2016-12-22
|
|
 |
Hydro Run of River Max Monthly Generation (1970 - 2015, May) |
Hydrography |
Argonne National Laboratory |
Water |
|
Abstract:
Depicts run-of-river (ROR) hydroelectric power plant sites in the U.S., attributed with descriptive information, and minimum and maximum power generation by month of year between 1970 and 2015. Symbolization shows the maximum monthly generation occurring between 1970 and 2015 in the month of May, which is the month with the highest overall generation.
Metadata File
Publication Date: December 2016 -
Data last updated: 2016-12-22
|
|
 |
Ecological risk to sensitive aquatic and riparian species at the HUC12 level due to water use |
Ecology |
Argonne National Laboratory |
|
|
Abstract:
Ecological risk to sensitive aquatic and riparian species at the HUC12 level due to water use
Data last updated: 2022-06-08
|